The Doty
Windfuels process will be able to make all the fuels and petrochemicals
modern society depends
from renewable energy,
CO
2, and water. As shown in much more detail in a technical
paper we presented at the Spring 2012 National meeting of the
American
Chemical Society, the dominant portion of the capital cost
for a Windfuels plant today would be the electrolyzers – everything
else will be minor, after development. Even with current prices
for electrolyzers and likely off-peak energy wind energy prices,
the Windfuels process can still produce carbon-neutral fuels
for under $2.50/gal. As scale-up of Windfuels drives the demand
for electrolyzers, their prices will steadily drop – probably
to under a quarter of current prices within a decade. The problem
for investors is that there is currently a cheaper way to make
fuels and petrochemicals in high volume – conventional
Gas to Liquids (GTL) processes.
For natural gas at
$5/mcf (its likely price in the U.S. by 2013), the cost of
the methane needed to make
a gallon of diesel by
a conventional GTL process would be $0.88/gal. In a very large
plant, the cost of capital, with 25 year financing, is ~$0.20/gal,
and O&M costs will be similar. The problem for environmentalists
is that there are is enormous CO2 release from the conventional
GTL plant even if the feed is pure methane – and shale
gas typically comes out of the ground containing 12-50% CO2,
which is just vented. So transport fuels via GTL using shale
gas is not environmentally friendly (no matter what the Big
Oil companies say).
Enter CARMA.
We have shown that
by adding some renewable hydrogen in a novel methane reforming
process (called CARMA)
it is possible to reduce
or eliminate the CO2 byproduct from methane reforming, or even
consume CO2 in the process. It depends mostly on the ratio
of renewable hydrogen to methane. The greater this ratio, the “greener” the
fuels produced.
The immediate response
might be, “But
the greater the H2/CH4 ratio, the more expensive the fuels.”
Not necessarily. Adding a small amount of hydrogen allows dramatic
reduction in coking rates and increases in catalyst lifetime
in key portions of the reforming process. It also permits design
of processes with higher efficiency. But the greatest benefit
comes from the flexibility it affords in input choice. The price
of off-peak energy grid energy can easily go from $20/MWhr to
sharply negative, and the price of natural gas can change by
a factor of three in several years. The CARMA process allows
the plant to operate at maximum efficiency over an extremely
wide range of input mixes as the markets change.
Over 90% of the input energy could initially come from shale
gas, while eventually the input energy could come totally from
renewable hydrogen. The amount of CO2 required by the CARMA process
increases with the H2/CH4 feed ratio. The table below summarizes
costs for several CARMA-GTL scenarios in small commercial plants
producing 5 Mgal/yr of fuels. These numbers come from complete
plant simulations using advanced process software (Design-II
by WinSim) and reaction software (HSC7). The numbers have been
validated by experiments and other software.
When the ratio of wind input energy to methane input energy
exceeds ~0.5, the capital costs are dominated by the electrolyzer
costs, for which we assume (extrapolating from the past decade)
a cost of $0.7/W in 2015. The electrolyzer also produces oxygen,
some of which is needed for the CARMA process. When the ratio
of wind energy to methane energy is above ~0.15, there is excess
oxygen, when can be sold. In the table below, revenue from excess
oxygen production is used to offset cost of inputs before calculating
net costs. In all cases, water usage is insignificant in cost
and quantity. Capital costs below assume the 3rd 5-Mgal/yr commercial
plant, interest rate of 5%, and 25-year financing.

As seen in the above table, fuels will be produced from a small
plant at costs ranging from $0.88-2.50/gal, and usually nearer
the low end of this range. Profit from the 5 Mgal/yr plant could
easily exceed $10M annually. Larger plants will achieve somewhat
higher efficiency, but the primary savings in larger plants will
come from reduced capital costs.
Preliminary laboratory
experiments have validated crucial questions with respect to
kinetics and catalyst performance – lifetime,
activity, and selectivity. The detailed plant simulations
show that the FTS gas-to-liquids processes can be scaled down
with
competitive cost and efficiency, achieving ~50% efficiency
in a 5 Mgal/yr plant and ~65% efficiency at 30 Mgal/yr.
CARMA is distinguished
from most alternatives in that it will be rapidly scalable
and immediately competitive
with relatively
little R&D. Adequate low-cost catalysts are commercially
available, though improved performance will be possible with
our novel, proprietary catalysts. CARMA will function as
a near-term bridging solution to the ultimate Windfuels process,
which will
use no methane. Our experiments have confirmed that the Reverse
Water Gas Shift (RWGS) reaction will permit the reduction
of CO2 to CO at efficiency approaching theoretical limits
in inexpensive
reactors. A proprietary low-cost catalyst we recently tested
achieved near theoretical CO2 conversion at rates 50 times
higher than seen in most prior RWGS experiments.
The domestic off-peak wind and point-source CO2 resources are
sufficient to supply more than the entire current domestic transport
fuel demand of 500 million gallons per day. Each year the US
emits over 4 gigatons of point-source CO2 (from fossil fuel power
plants, ammonia plants, cement factories, etc.) and based on
a recent study by NREL there is potential for over 1800 GW of
off-peak wind power just in the U.S. wind corridor. The only
significant scalability hurdle for Windfuels would be the cost
of the electrolyzers during the next decade. As long as natural
gas is cheap, the CARMA process will be more competitive, and
it too is fully scalable. Hence, CARMA technology will be used
in the early plants that will steadily and seamlessly transition
from low-carbon to fully carbon-neutral fuels over the coming
decade as wind hydrogen becomes more competitive. The internal
reactor designs and separation processes are identical between
the two processes, so the transition from CARMA to WindFuels
will involve little more than modularly adding additional electrolyzers
as grid integration needs increase and electrolyzer costs decrease.
Advantages for the novel Windfuels/CARMA-GTL processes include:
1. The synfuels produced are the cheapest alternative.
2. The synfuels do not compete with food or agriculture.
3. The CARMA-GTL fuels are cleaner than GTL synfuels with
very high methane feed percentage, cleaner than all other
fuels – including
biofuels – with as little as 30% renewable hydrogen, and
ultimately they will be fully carbon neutral – totally
from CO2 and renewable H2.
4. The processes are scalable to the level needed to
sustainably meet global transport fuel needs.
5. Windfuels will allow the US to become the world’s largest
exporter of clean fuels – forever.
6. The capital costs for the plants in $/bbl/day will
be similar to that for conventional GTL plants.
7. The CARMA process yields syngas with the needed H2/CO/(CH4+CO2)
ratios over a very wide range of CH4/H2 feed ratios when
appropriate CO2/H2O/O2 co-feed ratios are chosen.
8. The synfuels process is based mostly on demonstrated
commercial technologies.
9. CARMA eliminates the need for expensive very-high-temperature
heating to get the syngas.
10. Windfuels/CARMA-GTL will completely solve the wind
integration problem by drawing electrical power when
excess is available
at low prices.
11. The technology includes a scaling down of conventional
GTL processes to enable fuel production from distributed
methane
and wind sources. It will be efficient and competitive
in plants as small as 2 Mgal/year, with average wind
power input as low
as 1.3 MW.
Traditional thinking assumes very large plants are needed
for FT, largely due to the need for pure oxygen (in the
syngas process)
and due to the complexity of the separations systems. The
processes we have designed eliminate these drawbacks. Low-flow-rate
packed
columns can have performance (split ratios, cost/product,
etc.) similar to those of trayed columns with flow rates
two to three
orders of magnitude larger. These needed columns, phase
separators, and recuperators are not commercially available.
Hence, we are
developing the needed equipment, and it will soon form
the basis of major new product lines from Doty Windfuels.
Simplified Windfuels Economics Calculations.
Inputs and Outputs. The last decade of experience with GTL plants
shows that capital costs are a minor portion (~$0.20/gal) of
the total product cost, even though GTL plants are still being
designed and made individually. Relative capital costs should
be similar in mass-produced Windfuels plants, so clearly the
big economic issues are the costs of the feeds and the value
of the products.
The needed CO2 would initially come from commercial sources – ammonia
and CO2-rich natural gas. Cement factories, fossil power
plants, steel plants, and biofuels refineries are other potential
sources.
The CO2 could be delivered via the rapidly growing CO2 pipeline
network (currently driven mostly by enhanced oil recovery,
EOR). There is a large market for CO2. 300 million tons (Mt)
have been contracted for enhanced oil recovery (EOR), and
the beverage market requires tens of millions of tons/year.
Today,
the price of 99.5% pure CO2 (beverage quality) delivered
through high-pressure pipeline is $30-50/ton, and the CO2
pipeline
network is rapidly expanding.
As regulations to reduce CO2 emissions are implemented, competition
will drive the price down, as the only option other than selling
the CO2 will be to pay to exhaust it or pay to sequester it.
It is possible that the pipeline price of CO2 could drop to zero
if climate change policy becomes very stringent, since the actual
cost to separate and clean CO2 from the exhaust of new power
plants could drop below $25/ton within 8 years. Eventually, the
CO2 might come from the atmosphere, though with current technology
the energy required for separating CO2 from the atmosphere is
about 15 times greater than from point sources.
If the cost of the
input energy is $15/MWh (it has often been available for much
less) and the plant efficiency
is 55%, the
cost of the input energy in synthesized diesel (37.7 kWh/gal)
would be $1/gal. The CO2 (currently ~$40/t for beverage grade)
would add ~$0.4/gal, and the amortized plant capital costs
are expected to be under $0.75/gal (assuming some reduction in
electrolyzer
costs). This brings the gross fuel cost to ~$2.15/gal. The
liquid oxy¬gen co-product could add an income stream of ~$0.9
per gallon of fuel produced, and subsidies for carbon-neutral
fuels
could be ~$1/gal. So a rough initial estimate is that the
plant could sometimes sell fuels for as little as $0.25/gal and
still
break even.
Even with no market for oxygen, no credit for climate benefit
or grid stabilization, buying CO2 at current market prices, and
no utilization of natural gas, Windfuels would usually cost under
$2.20/gal.
Windfuels could
be competitive with oil trading as low as $55/bbl, depending
mostly on (1) the price
of off-peak low-carbon
grid energy, (2) the cost of electrolyzers, (3) the market
for the co-produced liquid oxygen (LOX), and (4) the consideration
available (such as a carbon tax) for climate benefit.
It is important to appreciate that there is sufficient point-source
CO2 potential in the U.S. (over 4 gigatons per year, Gt/yr) and
sufficient wind energy potential (~60 PWh/yr) to synthesize over
twice the current U.S. liquid fuel usage (~0.7 Gt/yr) and supply
twice its other energy needs (~20 TWh/yr).
The FTS process does not produce one specific chemical. Catalysts
and conditions are chosen for a desired product emphasis, and
the various products must then be separated. The mixture of products
(all carbon neutral and of exceptionally high-purity) would normally
include gasoline, jet fuel, diesel, ethanol, methanol, ethylene,
propylene, butanol, propanol, hydrogen, cyclohexane, and many
other hydrocarbons. The ratios depend on the catalysts and reactor
operating conditions (temperature, pressure, H2/CO feed mixture,
and residence time).
The Long-term Big Picture.
Chemical processes, unlike agricultural processes (including
growing and harvesting of algae) are fully compatible with
scale up. To illustrate, the larger demonstrations of photosynthetic
algal oil production to date (after two decades of strong
support) have been at the scale of a few hundred gallons
of fuel per
year, and costs thus far have all exceeded $2000/gal. (Non-photosynthetic
algae have done much better, but they’re just driving
up the price of sugar – like ethanol did to corn. Algae
might soon be making fuels from sugar at a price of $15/gal;
but with any significant scale up, the price of sugar will
go through the roof, and with it the price of the fuels derived
from it, whether made by yeast or algae.)
The US market needs
a supply of 200 Bgal/yr of sustainable, carbon-neutral fuels.
Diverting 40% of U.S. corn production to
ethanol to produce under 5% (on an energy basis) of our transportation
fuel needs has caused the mean global price of corn to roughly
double.
Advocates of cellulosic ethanol (CE) have been saying for the
past decade the US can find 1 gigaton of cheap CE feed stocks
and produce over 25% of our transport fuel needs from such. But
that would be equivalent to over three times the sum of current
domestic hay, energy wood, corn-stover, and municipal solid waste
production. Co-firing of such feed stocks in coal power plants
is seeking twice this amount of new biomass. Co-firing of biomass
in coal power plants has a much greater impact per ton on reducing
CO2 and other harmful emissions than CE production (co-firing
5-15% biomass with coal also has other beneficial effects, on
the nature of the ash produced), and co-firing is more economically
sound. Most available cheap biomass will likely be consumed in
co-firing.
If diverting 40% of
our corn production to ethanol caused its price to double,
diverting 70% of our wood,
hay, and corn-stover
production to energy would be much worse – putting
prices in the range of $200-600/ton, depending on quality,
location,
weather, wildfires, labor wages, and the price of oil. If
cellulosic feedstocks are $500/ton, the price of cellulosic
ethanol will
be $6.50/gal (comparable to gasoline at $9.70/gal). In contrast,
the price of Windfuels will only drop as its production scales
up, as there are no significant resource constraints.
At this point it seems
that an optimistic ultimate projection for CE will be under
1% of U.S. fuel production
(the DOE simply
doesn’t have the budget to build more capacity than
that over the next decade).
More importantly,
the operating margins on the WindFuels
plants will be much better – the cost of the inputs will
be much less per gallon of product, the products will be more
valuable, and there will be no waste to deal with.
In order to satisfy currently passed state renewable energy
standard (RES) mandates, there will need to be an additional
~300 TWh/yr of renewable energy produced in America within the
coming decade. Most of this new renewable generation will come
from wind, as no other source is nearly as competitive in most
regions of the U.S. As additional turbines are installed, curtailment
of wind turbines will increase during off peak demand times unless
additional demand comes online as well. The Windfuels and CARMA-GTL
processes can use that off-peak power, meaning that less energy
is wasted and turbine utilization increases. Curtailment in the
US alone is predicted to be 1.5 TWh (1.5x10⁹ kWh) for 2012.
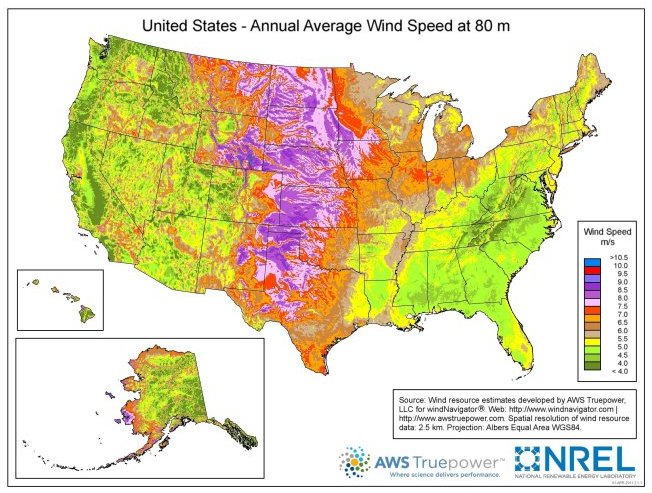
A challenge with wind
energy has been getting it from good sites to where and when
it is needed. The failure
of grid management
to overcome this challenge is shown in the continual curtailment
of wind power throughout the wind corridor (parts of 16 states
in the central US from Texas up through the Dakotas, with
a lesser branch reaching east to Ohio – purple, red, and
orange on the wind speed map below), which has contributed to
a rapid
slow-down in the wind industry. Both CARMA-GTL and Windfuels
provide rapid response to major changes in grid supply and
demand. Thus, windfuels will allow complete stabilization of
the grid,
even if over 50% of the grid energy comes from wind.
Since WindFuels would solve the grid stability challenges, the
best way to increase low-carbon peak grid capacity will be
to simply put up more wind farms. The extra, off-peak energy
will have a strong market for making carbon-neutral, transportation
fuels.
The primary challenge with pure Windfuels is that the prices
of electrolyzers have not been dropping as rapidly as was projected
by DOE studies. Electrolyzers simply cost too much to allow the
electrolyzer market to grow, which has prevented the identified
economy-of-scale cost reductions to come to pass. The CARMA-GTL
process solves this chicken-and-egg dilemma by reducing electrolyzer
requirements by a factor of five or more. Shale gas will steadily
become more expensive over the coming decade while the cost of
electrolyzers will continue to drop as demand from CARMA-GTL
processes drives the electrolyzer industry and leads to economies
of scale. It will be easy to add more electrolyzers and reduce
gas consumption at the CARMA-GTL plants in response to market
changes.
The competitiveness of the proposed processes and the absence
of resource constraints means that the U.S. could end oil imports
within three decades and at the same time begin building a clean-fuels
export industry of even greater magnitude, which will have enormous
security and economic benefits.
The U.S. is in a unique position of being able to competitively
turn CO2 into fuels at the scale needed to affect the global
fuels markets. No other country is similarly blessed with excess
clean-energy resources, point-sources of CO2, and the requisite
industrial infrastructure. The net positive effect on foreign-trade
balance of a market-driven industry of this magnitude could exceed
one trillion dollars annually by 2040. Such a positive effect
on trade balance could lead to the net creation of 10,000,000
jobs.
The U.S. eventually will likely not compete successfully with
Asia in solar panels, batteries, wind turbines, or EVs, but the
United States can supply most of the world with carbon-neutral
liquid fuels forever.
WindFuels are Forever.
Anthropogenic carbon emissions may soon be a little below what
was expected a few years ago – mostly because of increased
incentives for improved efficiency. However, the positive feedbacks
in the climate (especially from the melting of the Arctic)
could offset this progress.
There is still no evidence that hydrogen will ever work in the
transportation sector. Compared to WindFuels, there is no emissions
advantage and no significant efficiency advantage for hydrogen.
There are only huge cost disadvantages.
The public will slowly begin to appreciate that plug-in electric
vehicles will not have a significant effect on carbon emissions
for at least another three decades and that most biofuels are
only 5% to 20% carbon-neutral. As a result, incentives and support
for fully carbon-neutral WindFuels will steadily increase. Wind
will still be providing most of the energy needed for Windfuels
many decades from now, but an increasing fraction may come from
advanced nuclear reactors and solar as those industries steadily
become more competitive.
We show in our discussion of
Scalability why WindFuels will
not experience the same type of hyperinflation seen over the
past six years in biofuels, tar sands, CTL, nuclear, algae-oil,
wood pellets, and shale-oil.
WindFuels will be over 85%
carbon neutral, and they are completely sustainable. When the
last coal power plants are shut down in
~2090, the needed CO2 could come from biofuels refineries,
cement factories, ammonia production, steel mills, and the atmosphere.
References:
1. GN Doty, FD Doty, LL Holte, D McCree
and S Shevgoor, “Securing
Our Energy Future by Efficiently Recycling CO2 into Transportation
Fuels – and Driving the Off-peak Wind Market”,
Proc. WindPower 2009, #175, Chicago, 2009.
2. The Off-peak Wind Market
3. See http://wilderness.org/files/Oil-Shale-FS-global-warming.pdf .
4. Elizabeth Kolbert, “Unconventional Crude”, Annals
of Ecology, Nov. 12, 2007.
5. FD Doty and S Shevgoor, “Securing our Transportation
Future by Using Off-Peak Wind to Recycle CO2 into
Fuels”,
ES2009-90182, ASME Joint Conferences, San Francisco, 2009. Copyright ©2009
by ASME - used by permission for reference only.
6. FD Doty, “Hydrocarbon and Alcohol Fuels from Variable,
Renewable Energy...“, PCT WO 2008/115933,
7. G. Ramachandran, “Program on Technology Innovation:
Integrated Generation Technology Options”, EPRI, Technical
Update, Nov., 2008.
8. SM Cohen, GT Rochelle, J Fyffe, ME Webber, “The Effect
of Fossil Fuel Prices on Flexible CO2 Capture Operation”,
ES2009-90308, ASME Joint Conferences, San Francisco, 2009.
9. AP Steynberg and ME Dry, eds. Studies in Surface Science and
Catalysis 152, Fischer-Tropsch Technology, Elsevier, 2004.
10. S Phillips, A Aden, J Jechura, and D Dayton, “Thermochemical
Ethanol via Indirect Gasification and Mixed Alcohol Synthesis
of Lignocellulosic Biomass”, NREL/TP-510-41168, 2007.
11. K Harrison, G Martin, T Ramsden, G Saur, “Renewable
Electrolysis Integrated System Development and Testing”,
NREL PDP_17_Harrison, 2009, http://www.hydrogen.energy.gov/pdfs/review09/pdp_17_harrison.pdf .
12. FD Doty, “High-Temperature Dual-source Organic
Rankine Cycle with Gas Separations”, PCT
WO 2009/048479, 2009.
13. FD Doty, “Compact, High-Effectiveness, Gas-to-gas
Compound Recuperator with Liquid Intermediary”,
PCT WO-09082504.
14. See http://www.acorechina.org/uscp/upload/6-11-2009.pdf,
Chinese wind turbine growth.
15. See http://www.rechargenews.com/energy/wind/article180724.ece,
Chinese wind turbine prices.
16. See http://www.renewableenergyworld.com/rea/news/article/2009/06/wind-turbine-prices-move-down-says-new-price-index?cmpid=WNL-Wednesday-July1-2009
2009.
17. See http://www.grist.org/article/concentrated-solar-power-goes-mainstream/ , and http://social.csptoday.com/news/gerc-proposes-tarriff-solar-thermal-power , 2009.
18. K Weissermel, HJ Arpe, Industrial Organic Chemistry, 4th
ed., Wiley, 2003.
19. HR BioPetroleum, http://www.hrbp.com/PDF/Huntley%20&%20Redalje%202006.pdf
20. Eric Wesoff, http://www.greentechmedia.com/articles/algae-biodiesel-its-33-a-gallon-5652.html
2009.
21. M Voith, “Cellulosic Scale-up”, C&EN 87 (17),
pp10-13, Apr 27, 2009.
22. A 600,000 gallon tank was quoted by Brown Minneapolis Tank
Company as costing about $420K, or under $0.02/kWhr for jet fuel.
-